
A malware sandbox is a versatile solution that offers a variety of tools for studying malicious behavior, including threats’ network traffic.
A quick sandbox analysis can reveal tons of useful information, such as the malware’s communication with its command-and-control server and external sources where its payloads are stored. Let’s find out what else a sandbox can help us learn as part of traffic investigations.
1. HTTP Requests Analysis
HTTP request analysis is a method of examining the details of connection requests made by the malware.
Example: Exposing Malware’s Evasion Attempt

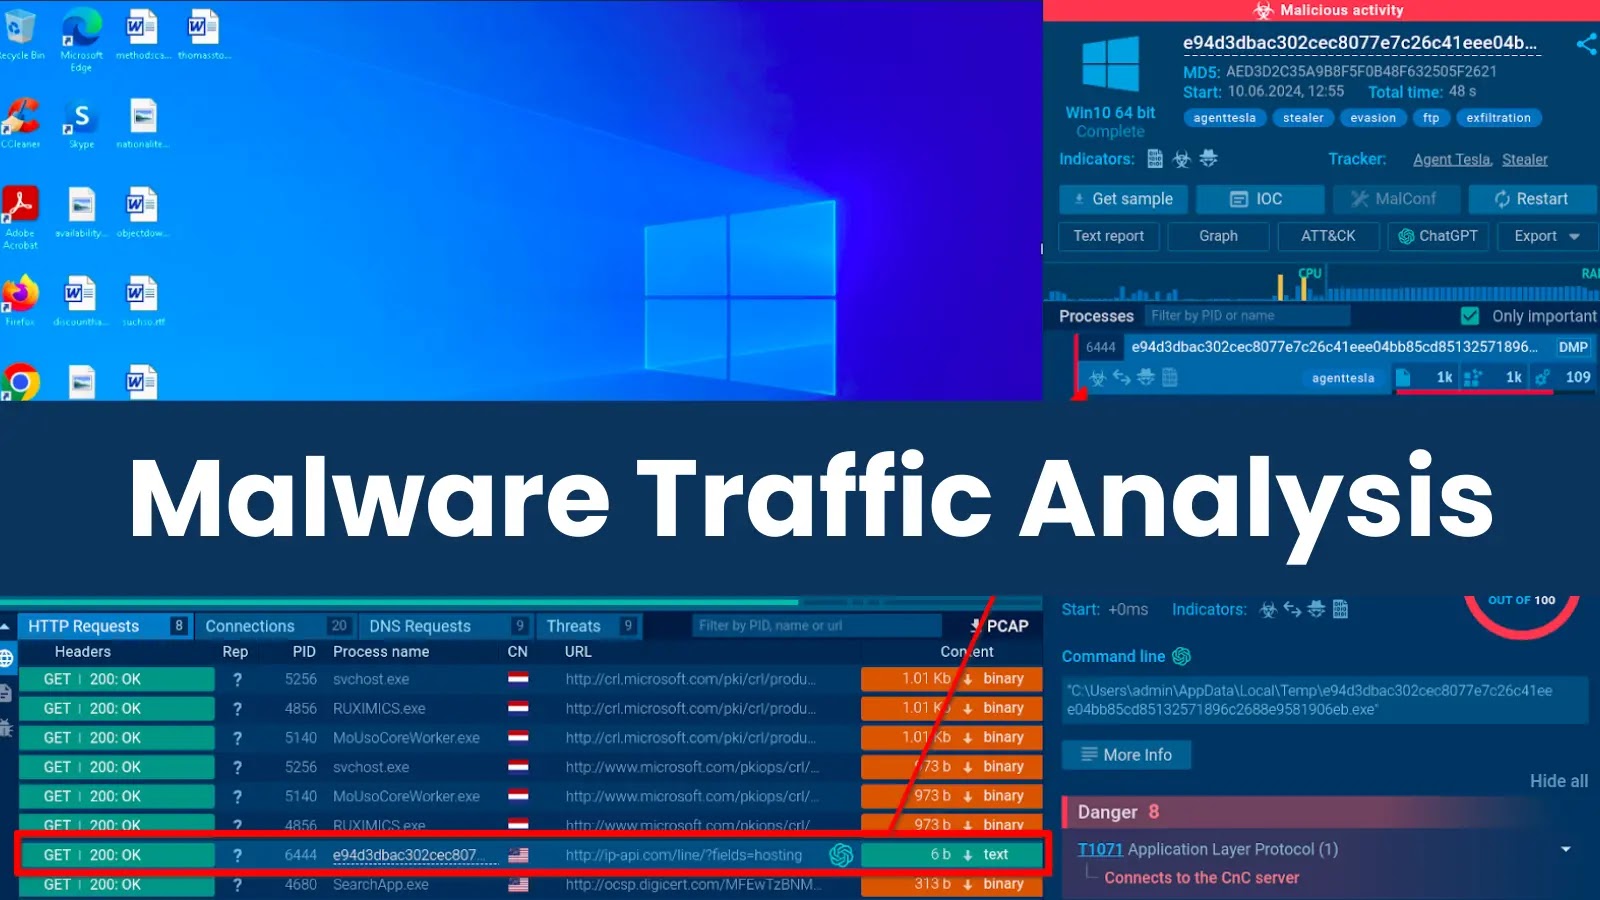
The HTTP Requests tab reveals connections which are related to specific processes launched during the malware execution.
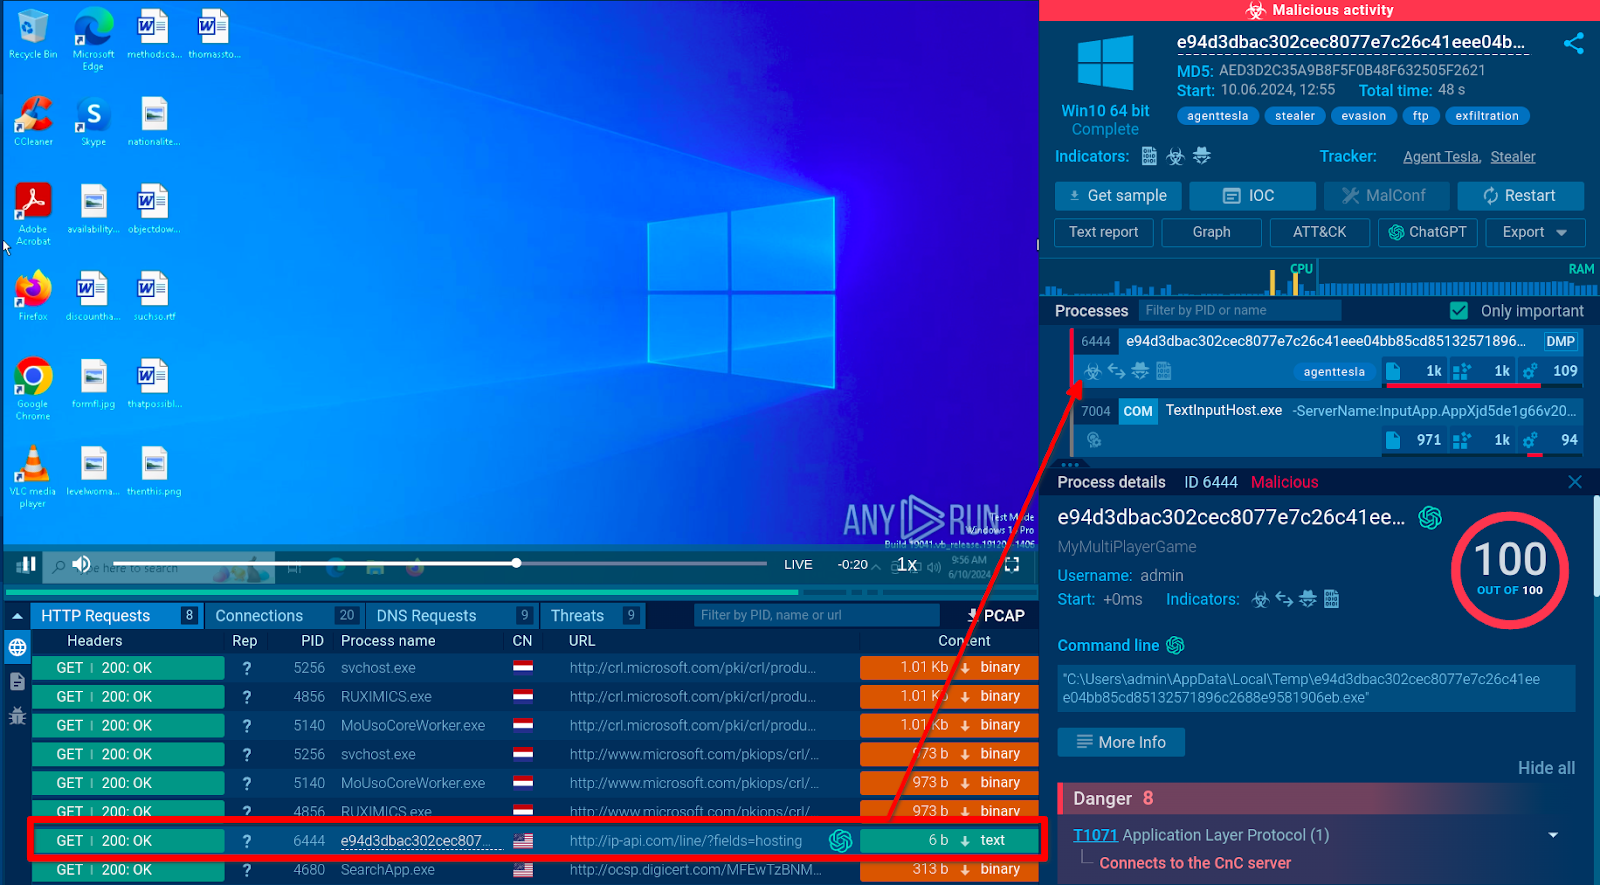
HTTP connection and the PID 6444 process it corresponds to
In our case, the PID 6444 process corresponds to the Agent Tesla payload. Further examination of the HTTP protocol connection associated with the process shows that the malware attempted to connect to ip-api.com, a legitimate internet diagnostics service.
Threat actors use it to gather additional client information, including to detect a sandbox environment by checking if the machine is using a hosting provider IP address. The malware may cease operation to evade detection based on this information.
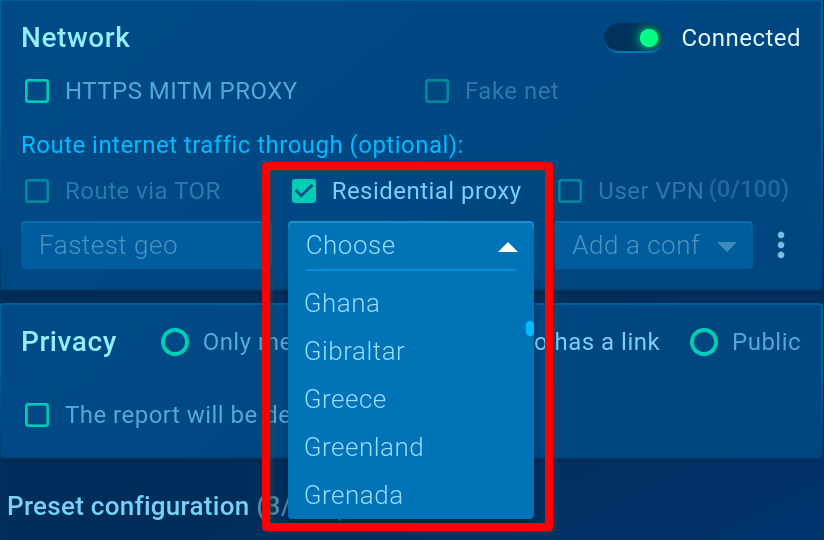
Residential proxy lets you select any preferred country’s residential IP
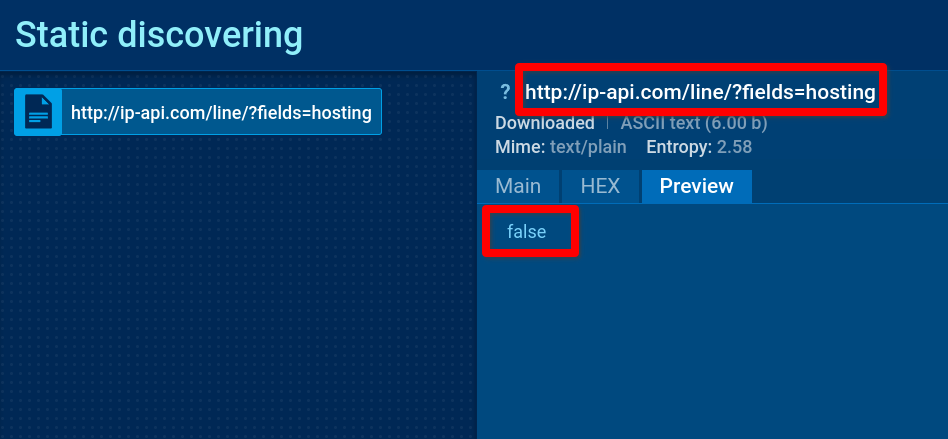
When clicking on the ip-api.com connection in the HTTP Requests tab of the network block, we see HTTP connection data such as the URL for the GET request (…ip[-]api[.]com/line/?fields=hosting) and the server’s response – false.
2. Suricata Rule Detection
Example: Viewing Agent Tesla’s C2 Communication
Let’s continue with the analysis of the Agent Tesla sample and explore the list of triggered Suricata rules. The service shows that all the threats detected by Suricata IDS stem from the same PID 6444 process.
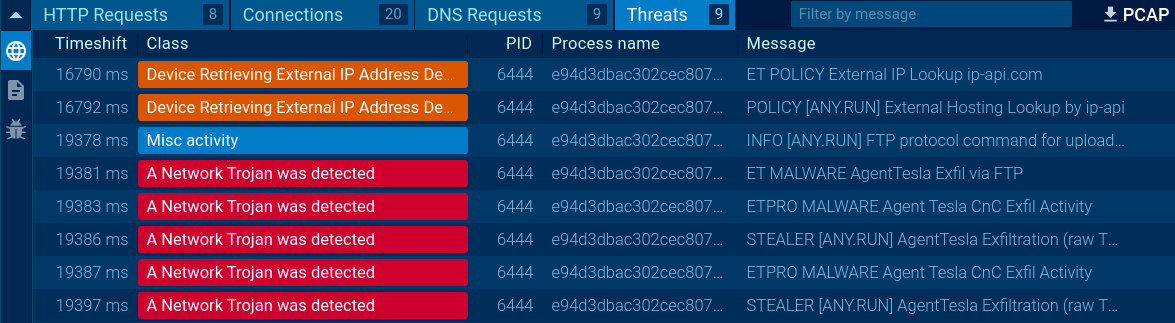
Selecting the IDS alert at 19 sec. 381 ms after the analysis launch by clicking on the message “ET MALWARE AgentTesla Exfil via FTP” indicates that the malware uses a C2 FTP channel for data exfiltration.
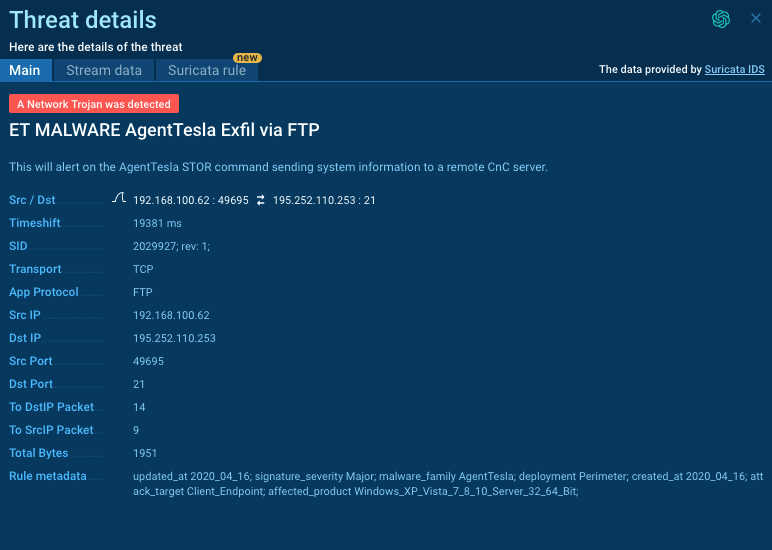
In the opened window, there are three tabs: Main, Stream Data, and Suricata rule.
The Main tab provides details about the threat, including metadata, a description of the triggered rule, a copyable filter for easy searching of the connection in Wireshark, transport layer and application layer protocols, addresses and ports of the connection.
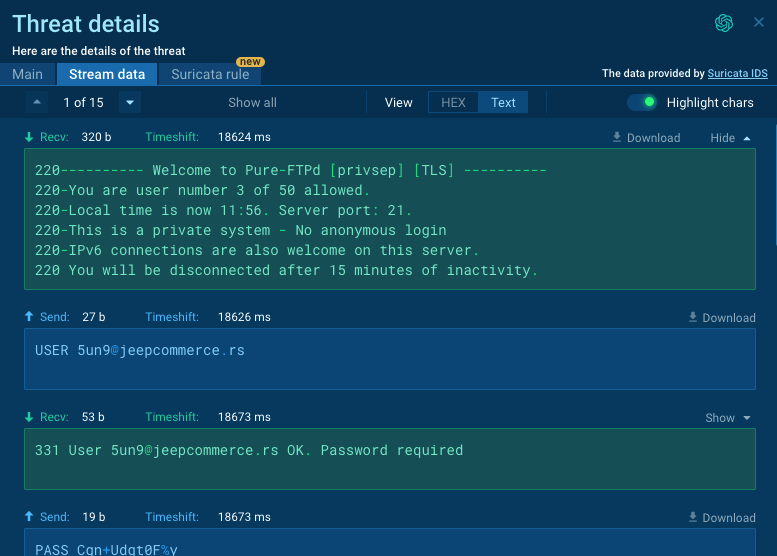
The Stream Data tab lets you view the in-depth connection data in a convenient, compact format. It makes it easy to expand network messages and scroll through them.
The Suricata rule tab allows you to explore the details of the Suricata rule used for detection.
3. Network Stream Analysis
The analysis provides insights into malware configuration (proxies, C2 addresses, data packing/retrieval), stolen data (passwords, logins, cookies), and downloads (including PE files).
Example: Viewing Malware’s Connections
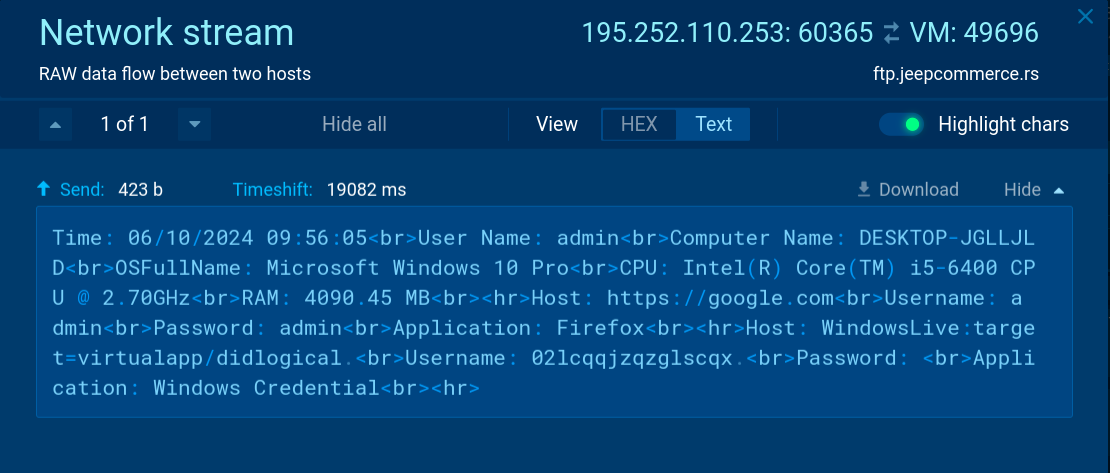
Clicking on the Agent Tesla client’s connection with ftp.jeepcommerce[.]rs on port 60365 displays a Network Stream window, where we can study the communication between the two hosts.
Here, you can also get a Wireshark filter or select and copy HEX/Text substrings for further use, e.g., in CyberChef.