The 2026 World Cup did more than fill stadiums and television screens. It reshaped when millions of people used the Internet, creating noticeable surges and dips in web activity across countries.
The shifts were tied to local kickoff times, streaming habits, halftime pauses, and the teams that captured the widest attention.
This was not a malware outbreak or a cyberattack, and the available data identifies no affected victims, compromised systems, or hostile infrastructure.
Instead, the event offers a useful view of how live sport can change the load placed on digital services. For defenders and network operators, the pattern reinforces why normal traffic baselines matter when identifying unusual activity.
Cloudflare analysts noted the changes using Radar data drawn from HTTP requests across a global network that spans 330 locations.
They compared each minute of tournament traffic with the median of the previous four weeks, allowing activity in countries with very different Internet use to be measured on the same relative scale.
A positive score represented above-normal traffic, while a negative score marked a fall. Cloudflare said in a report shared with Cyber Security News (CSN) that the World Cup created a rare, visible footprint in global online behavior.
The findings also show why analysts should not equate every sudden traffic jump with an attack: the timing, audience, and type of content being requested can provide essential context.
Which World Cup Teams Moved the Global Internet Most
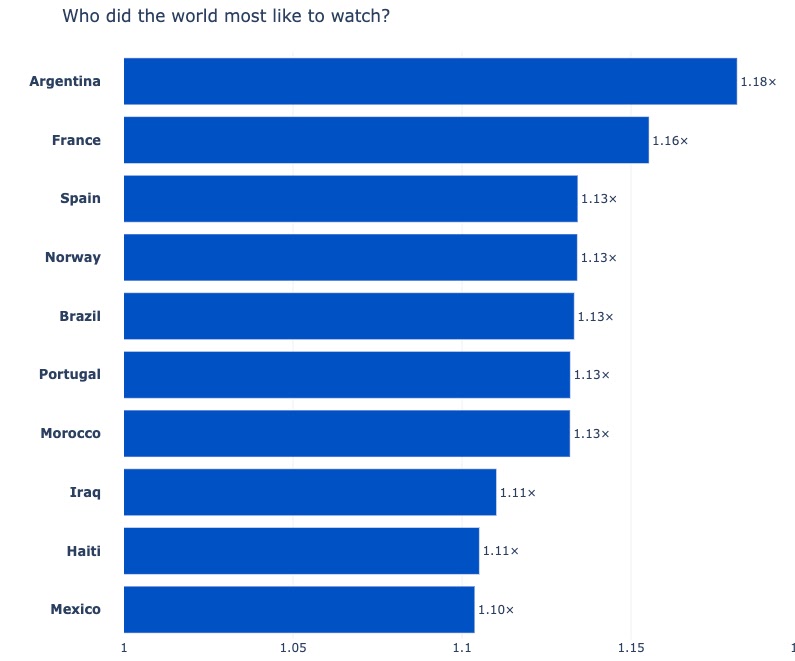
Argentina produced the strongest team-level effect, with a median worldwide traffic deviation of 1.17 times normal when it played.
France, Brazil, Portugal, Morocco, Spain and Norway also ranked prominently, while Haiti and Iraq stood out because matches involving bigger opponents caused unusually large changes relative to their usual traffic.
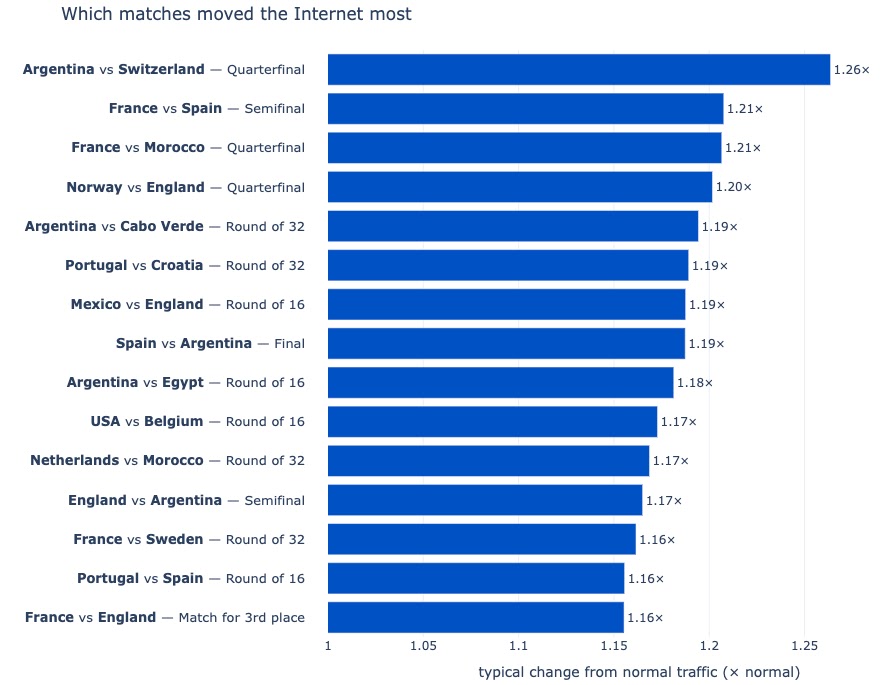
Readers tracking broader shifts can compare this with bot-driven web traffic trends. The single match that moved the Internet most was Argentina versus Switzerland on July 11, a quarterfinal Argentina won 3-1.
Its global impact factor reached about 1.26, ahead of the France versus Spain semifinal at 1.21. The result is notable because a quarterfinal, rather than a final, produced the largest worldwide deviation from normal browsing behavior.
Kickoff timing explained much of the variation. Matches held between midnight and 8 a.m. local time often lifted traffic above normal because fans stayed awake or rose early, sometimes more than doubling demand.
Daytime fixtures generated smaller changes, since many viewers were already connected, whereas evening matches created a more modest bump as everyday use normally declined.
Brazil’s Round of 32 meeting with Japan made the time-zone effect clear. Japan’s traffic was roughly double its normal level during the overnight game, while Brazil’s fell below normal during ordinary waking hours.
Such differences are relevant for capacity planning, and DDoS traffic capacity lessons show why separating expected demand from hostile traffic is important.
Streaming Changes Break Patterns
Streaming behavior shaped what happened during breaks. In the largest cluster, covering 44 countries and 101 matches, traffic rose during hydration breaks and halftime as viewers checked phones or other services.
A smaller cluster of eight countries and 18 matches showed the reverse pattern, with traffic dropping during pauses.
Algeria and Austria illustrated the divide during their June 28 group-stage match. Algeria’s traffic climbed during play and dropped at halftime, a trend linked to greater multimedia and streaming requests, while Austria’s traffic increased during the break.
That contrast makes context vital when analyzing malware network traffic, because a volume change alone does not explain user intent.
Traffic to gambling websites also rose after the opening game and became more constant than the clear weekly rhythm seen before the tournament.
That increase deserves attention because large sporting events can attract scams, including fake gambling ad campaigns that steer users toward unsafe apps or bogus pages.
Users should verify offers through official sites and avoid software promoted through social-media advertisements.
Organizations should monitor expected peaks, preserve baselines by region and time, and investigate anomalies alongside content mix and schedules. This approach reduces false alarms without overlooking major genuine disruption or abuse.